Understanding Visitation Patterns to POIs During a Natural Disaster
This event was led by Levente Juhász and Hartwig H. Hochmair and covers their recent research findings studying visitation patterns during Hurricane Urma - allowing analysis of visitation patterns during a natural disaster.
Their examination of SafeGraph’s dataset for Florida focuses on three major cities (Miami, Orlando, and Jacksonville), with the aim of introducing SafeGraph as a new data source for the Geographic Information Science community.
Visitation patterns decrease based on temporal relation to a natural disaster
They mapped average point of interest (POI) visits by POI category (grocery stores, gas stations, and universities). They also note major events, such as when universities cancelled classes, when the mandatory evacuation order took effect, and when the storm was closest to Miami.
Their findings showed a clear relation between visitation patterns and the temporal proximity to the natural disaster, and related government orders. Visits to these locations spiked prior to the hurricane, and then drastically decreased during the period of the natural disaster. Once over, you see a steady increase in visitations.
How SafeGraph enabled research on visitation patterns during a natural disaster
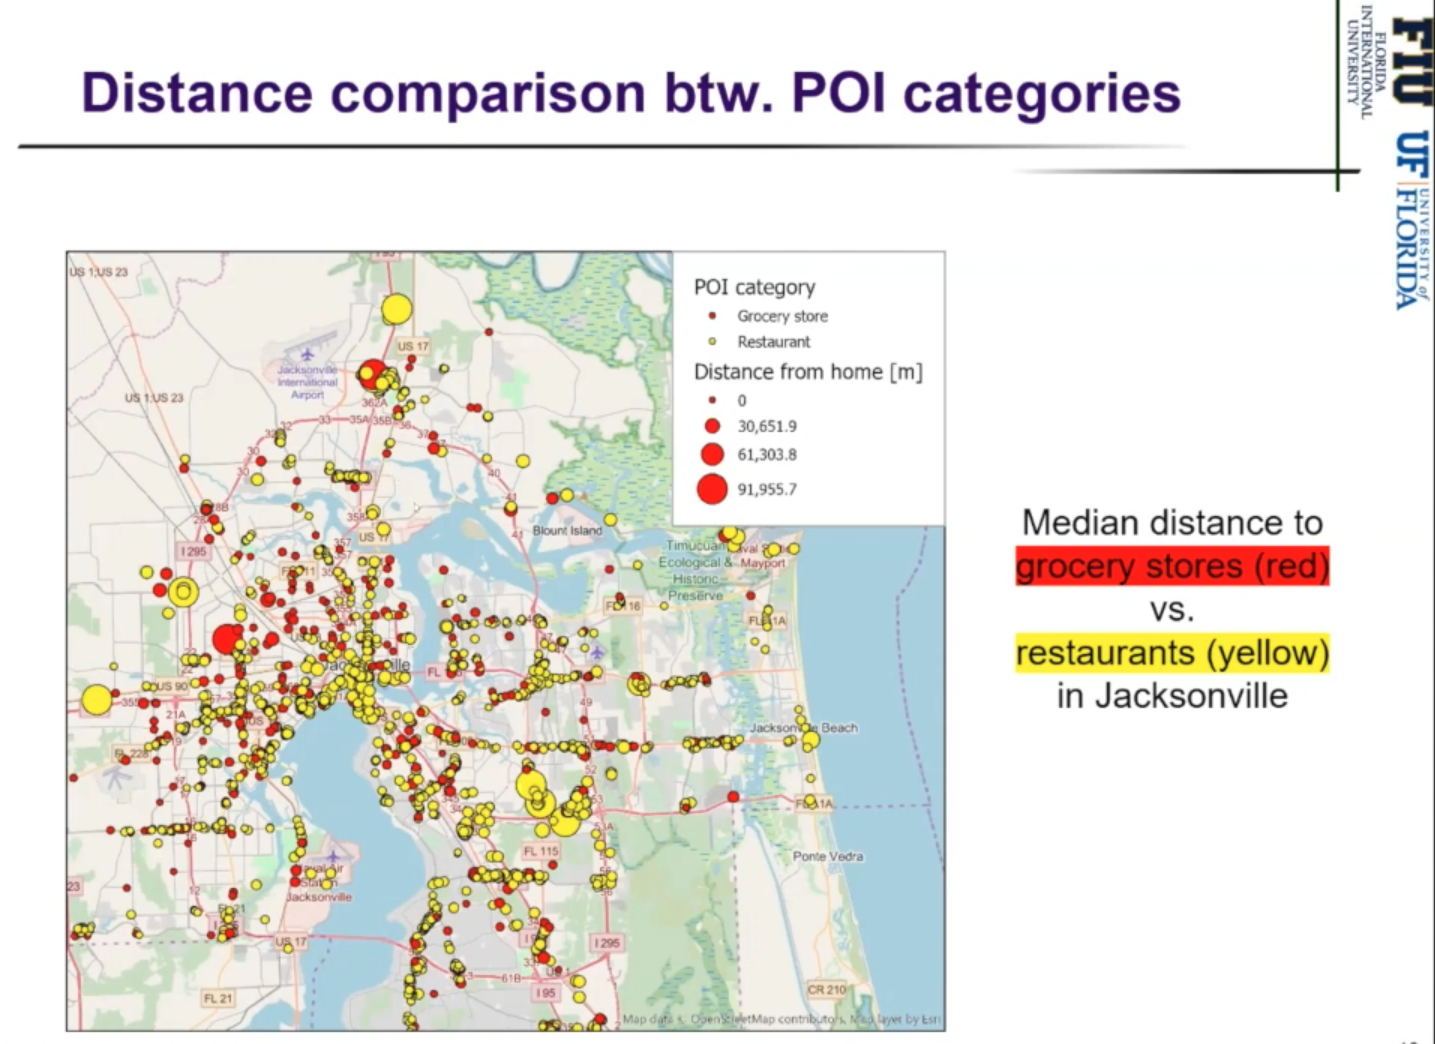
SafeGraph point of interest (POI) data allowed researchers to categorize the places that people visited by the type of place it is. They can then use mobility data from SafeGraph to understand how frequently different census block groups (CBGs) visited these locations, their median dwell time, and the distance traveled from their home.
This data can be paired with demographic information to understand and analyze how people interact with POIs around them. By analyzing specific periods of time, they can use this information to compare visitation patterns during natural disasters (such as Hurricane Urma or the COVID-19 pandemic).
To learn more about how SafeGraph enabled this research and share ideas with other users, join the SafeGraph community!
%20.png)