%20.png)
Visualizing Vaccination Rates and Movement Patterns
Thomas Young, founder of Econometric Studios, interprets the data visualizations created using R and Tableau to display vaccination rates with movement data. He walks you through exactly how he produced this data visualization himself through the SafeGraph Shop, and explores how he can manipulate the data for better visualizations.
He shows you exactly how to set up the datasets and then point Tableau towards it for enhanced data visualization and manipulation. He explains that this is easy to do, as it’s very “user friendly”. Young then walks you through an analysis of the datasets he created that visualizes vaccination rates and mobility patterns in a number of different ways.
Flexible, interactive data visualizations showing the impact of vaccination on movement
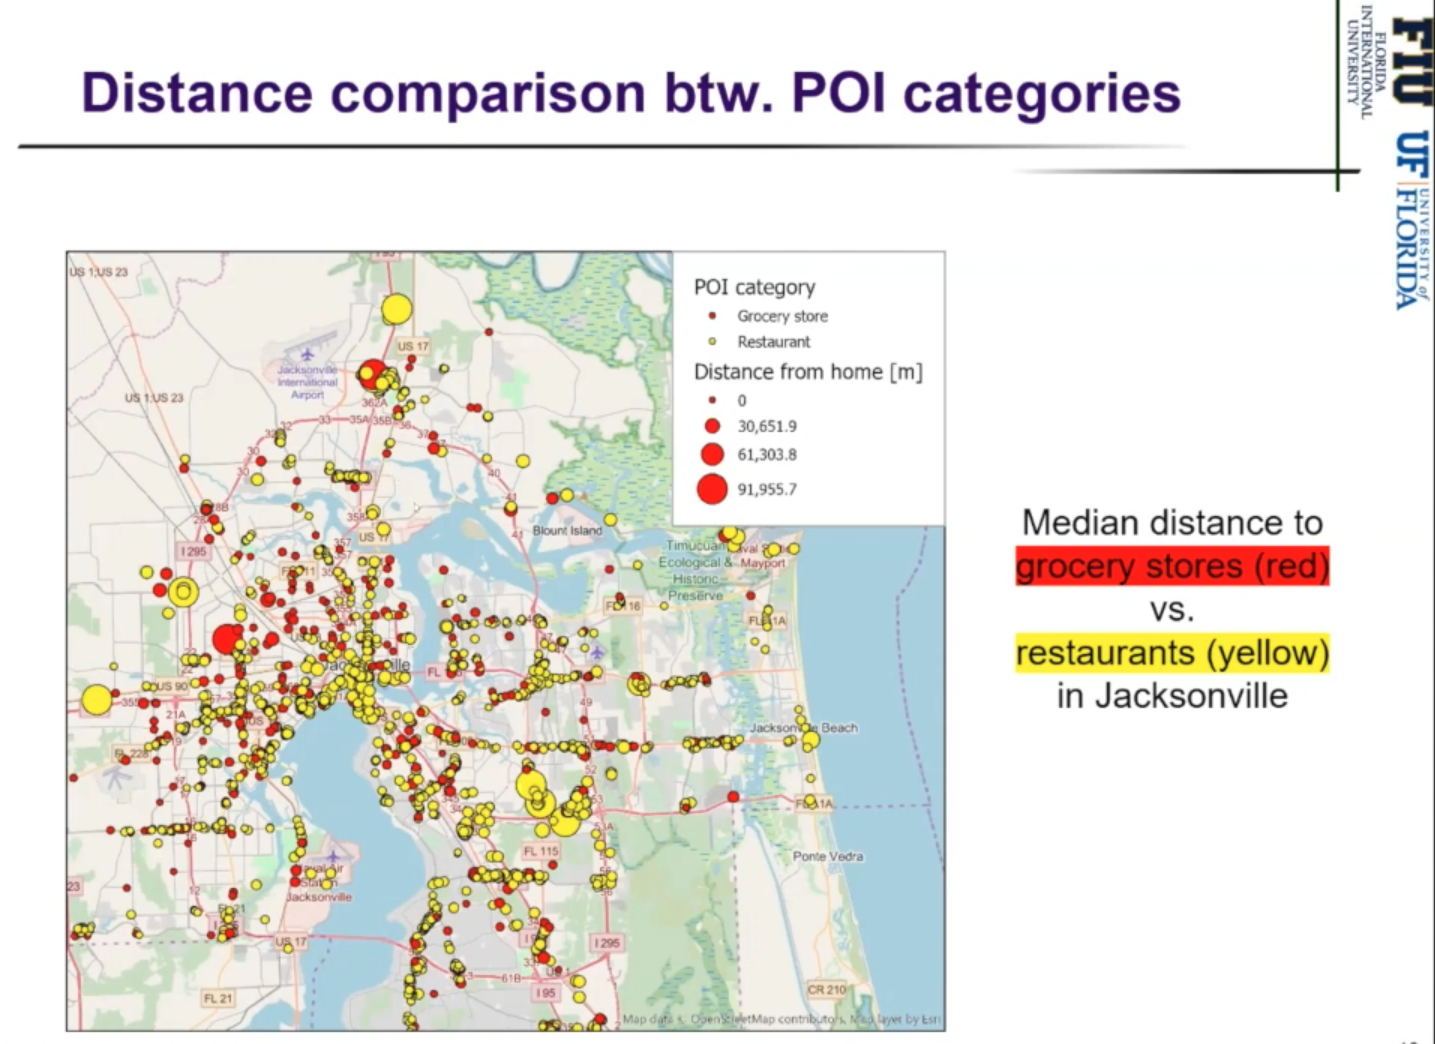
The product of this project was a complete Tableau dashboard offering different ways of visualizing US COVID-19 vaccination rate data. He displays vaccination rates (as a percent of the population aged 18+) by state as both a graph and a heatmap. A map also plots all POIs being examined, and another table shows data for visits to all POIs.
In the interactive Q&A, Young explores how the data can alternatively be displayed in Tableau, and works through the process so others can easily do this themselves.
How SafeGraph enabled research on vaccination rates and movement patterns
This complex, interactive data visualization is made possible using SafeGraph’s point of interest and foot traffic data. This enabled Young to plot POIs with confidence, and allowed easy filtering and manipulation of how data is displayed. This flexibility makes it easy to work with SafeGraph data, and this seminar serves as a great example of the things you can create using our datasets!
To learn more about how SafeGraph enabled this research and share ideas with other users, join the SafeGraph community!